Average Percentage 2026
Find the simple or weighted average of any set of percentages
Average Percentage Calculator
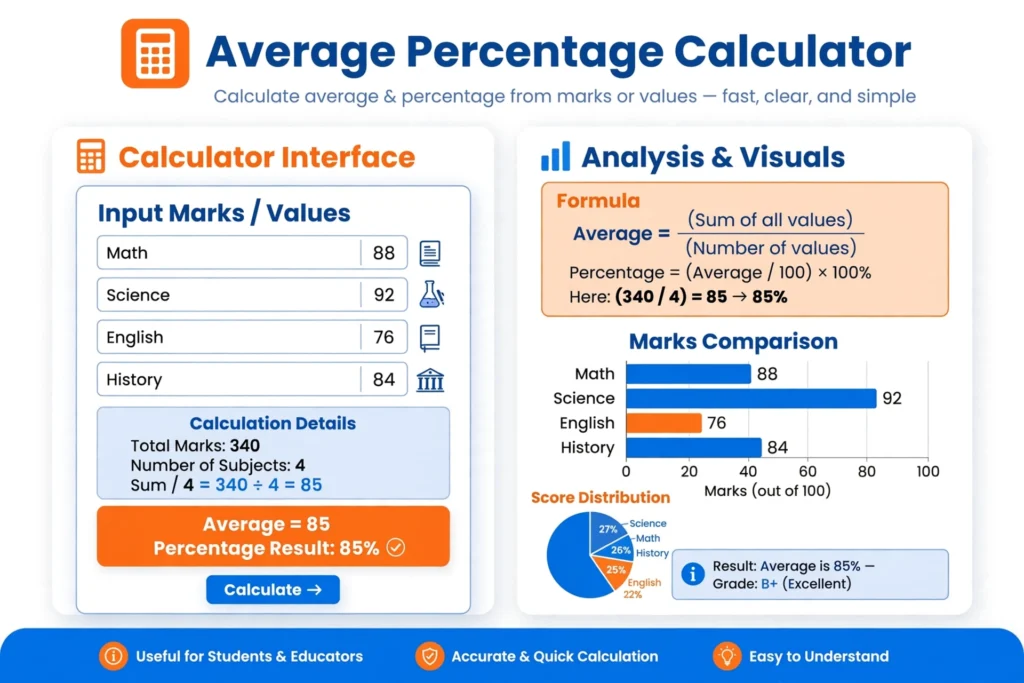
* Simple average adds up all percentages and divides by the count. Blank or non-numeric rows are ignored.
Table of Contents
Averaging percentages is one of the most common yet frequently misunderstood tasks in statistics, finance, education, and business analytics. While it seems simple to sum up percentages and divide by the count, doing so without considering sample sizes, base values, or compounding growth often leads to wildly inaccurate conclusions.
This guide breaks down how to calculate the average of a set of percentages, when to use simple versus weighted averages, how geometric mean applies to growth rates, and how to avoid mathematical errors when analyzing percentage data.
1. Percentage Fundamentals: Conversion and Terminology
Before calculating averages, it is essential to establish the foundational math behind percentages and raw data conversions.
Basic Formula for Calculating a Percentage
A percentage represents a fraction or proportion out of 100. The basic formula for calculating a percentage is:
$$\text{Percentage} = \left( \frac{\text{Part}}{\text{Total Base}} \right) \times 100$$
How to Convert Raw Scores into Percentages Before Averaging
To analyze performance across multiple tasks or tests, convert each raw score into a percentage first by dividing the points earned by the total points possible and multiplying by 100.
- Example: Scoring 18 out of 20 yields $\left(\frac{18}{20}\right) \times 100 = 90\%$. Scoring 42 out of 50 yields $\left(\frac{42}{50}\right) \times 100 = 84\%$.
Key Terminology Distinctions
Understanding the difference between average percentage and percentage of total prevents major analytical misinterpretations:
- Average Percentage: The central value of multiple individual percentage figures (e.g., the average of 80%, 85%, and 90% is 85%).
- Percentage of a Total: A single proportion comparing a subcomponent to a grand total (e.g., sales in Region A divided by company-wide sales).
- Percentage of Average: Comparing a specific data point to the calculated average of the entire dataset (e.g., evaluating whether an employee’s performance is 110% of the team average).
2. Simple vs. Weighted Average Percentages
The single biggest error in data analysis is treating all percentages as equals regardless of their original sample sizes.
Why You Cannot Always Just Add Percentages Together and Divide by Count
A simple average of percentages adds all percentage values and divides by the total number of items:
$$\text{Simple Average} = \frac{P_1 + P_2 + \dots + P_n}{n}$$
This method is mathematically valid only when every percentage comes from an identical base size. If the underlying totals (sample sizes) differ, a simple average distorts the true reality because it assigns equal weight to groups of unequal size.
Simple Average vs. Weighted Average of Percentages
| Feature | Simple Average | Weighted Average |
| Formula | $\frac{\sum P}{n}$ | $\frac{\sum (w_i \times P_i)}{\sum w_i}$ |
| When to Use | All group sample sizes / base values are identical. | Group sample sizes or base values differ. |
| Accuracy with Varying Base Sizes | Low (produces misleading results). | Exact (reflects absolute counts). |
| Role of Sample Size ($w_i$) | Ignored completely. | Dictates each percentage’s impact on the total. |
Why Direct Averaging Gives Misleading Results
Suppose a clinic tests two patient groups for treatment efficacy:
- Group A (Small size): 9 out of 10 patients recover (90%).
- Group B (Large size): 10 out of 100 patients recover (10%).
If you take a simple average:
$$\frac{90\% + 10\%}{2} = 50\%$$
However, out of 110 total patients across both groups, only 19 recovered. The true recovery rate is:
$$\left(\frac{19}{110}\right) \times 100 = 17.27\%$$
Averaging percentages directly yields 50%, overstating effectiveness by over 32 percentage points.
Correct Method to Average Percentages from Different Total Bases
To calculate a weighted average percentage across groups of different sizes, use the original raw numbers or multiply each percentage by its base weight:
$$\text{Weighted Average Percentage} = \frac{\sum (\text{Weight}_i \times \text{Percentage}_i)}{\sum \text{Weight}_i} = \frac{\text{Total Part Units}}{\text{Total Base Units}} \times 100$$
An Average Percentage Calculator handles different group sizes by prompting the user for either the raw counts or the specific weight (sample size) corresponding to each percentage point.
3. Averaging Percentage Changes, Increases, and Decreases
Evaluating changes over time requires distinct rules compared to static score averages.
Average Percentage Increase and Decrease Across Multiple Values
When tracking percentage changes across multiple periods, you must account for direction (positive for increases, negative for decreases). An online percentage calculator processes negative percentages by subtracting them from the running total during weighted aggregation.
Formula for Average Percentage Change Over Several Periods
The average percentage change across $n$ consecutive periods based on raw starting and ending values is:
$$\text{Overall Percentage Change} = \left( \frac{\text{Final Value} – \text{Initial Value}}{\text{Initial Value}} \right) \times 100$$
Why Averaging Percentage Changes Differs from Averaging Raw Percentages
Averaging percentage changes directly ignores base shifts. If a stock worth $\$100$ increases by $50\%$ in Year 1 (to $\$150$) and decreases by $50\%$ in Year 2 (to $\$75$), the arithmetic average of the percentage changes is:
$$\frac{+50\% + (-50\%)}{2} = 0\%$$
However, the investment actually lost $\$25$ (a net $25\%$ loss). This proves that the order of percentage increases and decreases matters and that percentage changes cannot simply be summed arithmetic-style.
Calculating Combined Discounts
When multiple discounts apply sequentially (e.g., $20\%$ off, then an extra $10\%$ off at checkout), you cannot add them to get $30\%$.
$$\text{Overall Discount} = 1 – [(1 – 0.20) \times (1 – 0.10)] = 1 – (0.80 \times 0.90) = 0.28 \text{ or } 28\%$$
4. Arithmetic Mean vs. Geometric Mean for Growth Rates
When dealing with cumulative or compounding percentages, the arithmetic mean fails.
Compounding Growth Over Time (e.g., Financial Returns)
   │
   ├── Arithmetic Mean: Ignores compounding effects (Overestimates performance)
   │
   └── Geometric Mean: Accounts for compounding (Accurate rate of return)
Key Differences in Percentage Averaging
- Arithmetic Mean: Adds values and divides by count. Suitable for independent, non-compounding figures.
- Geometric Mean: Multiplies growth factors and takes the $n$-th root. Necessary for compounded growth rates, financial returns, and multi-year metrics.
Formula for Geometric Mean of Percentages
To calculate the average percentage return on an investment over $n$ years:
$$\text{Geometric Mean Return} = \left[ \prod_{i=1}^{n} (1 + R_i) \right]^{\frac{1}{n}} – 1$$
Where $R_i$ is the percentage return in decimal form for year $i$.
When to Use Geometric Mean
Use the geometric mean when calculating:
- Compound Annual Growth Rate (CAGR)
- Multi-year investment returns
- Population growth over consecutive decades
5. Real-World Applications: Education, Surveys, and Business
1. Education: Exam Scores and Course Credit Hours
How to calculate the average percentage of multiple exam scores: If all exams have equal maximum points (e.g., 100 points each), sum the percentages and divide by the number of exams.
However, when subjects have different credit hours, you must calculate a weighted average percentage grade:
$$\text{Final Grade Percentage} = \frac{\sum (\text{Course Percentage} \times \text{Credit Hours})}{\sum \text{Credit Hours}}$$
A teacher’s average of student percentages often differs from a simple calculator because teachers account for weighted categories (e.g., Homework 20%, Exams 80%) or varying assignment point totals.
2. Class Pass Percentages
To calculate the average pass percentage across multiple classes or sections, multiply each class’s pass rate by its total enrolled students, sum those values, and divide by the total number of students across all classes.
3. Survey Weighting Across Different Sample Sizes
Combining survey results from different sample sizes requires weighting each group’s response percentage by its sample size ($N$). Without weighting, a survey of 10 people carries the same influence as a survey of 10,000 people.
4. Business Growth Metrics
Measuring quarterly business performance requires calculating percentage changes relative to baseline performance. Using weighted averages ensures high-revenue quarters reflect their true impact on annual performance metrics.
6. Statistical Reliability, Distributions, and Nuances
Small Sample Sizes and Statistical Unreliability
Averaging percentages derived from small sample sizes (e.g., 1 out of 2 = 50%) introduces high volatility. Knowing the total sample size before trusting an average percentage figure is critical to ensure statistical significance.
Standard Deviation Alongside Average Percentage
An average percentage alone does not reveal data dispersion. Two datasets can share an identical $50\%$ average percentage while possessing entirely different underlying distributions:
- Dataset A: $49\%, 50\%, 51\%$ (Low standard deviation, high consistency)
- Dataset B: $0\%, 50\%, 100\%$ (High standard deviation, high variance)
Reporting the standard deviation alongside the average percentage provides necessary context regarding stability and risk.
Cumulative Average Percentage
A cumulative average percentage updates dynamically as new data arrives:
$$\text{Cumulative Average}_{k} = \frac{(\text{Previous Cumulative Sum}) + \text{New Value}}{k}$$
7. Average Percentage Calculators and Verification Best Practices
Required Inputs for an Average Percentage Calculator
A robust digital calculator requires:
- Percentage Values ($P_i$) or Raw Parts.
- Weights ($w_i$) or Total Base Sizes.
- Calculation Mode Selection (Simple, Weighted, or Geometric/Compounding).
Handling Missing or Blank Data Points
Calculators must strip out missing values entirely from both the numerator sum and the denominator count/weight sum. Leaving missing entries as zero artificially depresses the calculated average percentage.
Common Manual Calculation Errors to Avoid
- Adding percentages together without weighting when base sizes differ.
- Averaging annual percentage returns with arithmetic mean instead of geometric mean.
- Premature Rounding: Rounding intermediate percentages to whole numbers before finishing the calculation introduces significant cumulative error. Always maintain raw decimals until the final step.
- Ignoring Base Changes: Treating a 20% increase followed by a 20% decrease as returning to the starting baseline.
Verifying Calculation Correctness
To verify any average percentage calculation, convert all figures back to raw fundamental units:
- Sum all the individual “part” values to get the Grand Total Part.
- Sum all individual “base” values to get the Grand Total Base.
- Divide Grand Total Part by Grand Total Base and multiply by 100. If the weighted average matches this outcome, the calculation is mathematically correct.